While measurement is incredibly valuable, it can also seem very hard. Common measurement mistakes include:
- Thinking about measurement as a certain ‘true fact’ about the world
- Not thinking about their goals and why they measure
- Not measuring the right things
- Not making good measurements
- Misunderstanding what makes for a good measurement
- Avoiding measuring things that are hard to measure
- Drawing the wrong conclusions from their measurements
The good news is it doesn’t have to be this way. We can reap the enormous benefits of good measurements by simply understanding and finding some good answers to these questions:
- What is measurement?
- Why do we measure things?
- How do we decide what measurements to make?
- What makes for a good measurement?
- How do we make good measurements?
- How do we measure difficult or ‘intangible’ things?
- How to draw conclusions from measurements
What is measurement?
My favourite definition of measurement is “the reduction of uncertainty”.
In reality there is rarely conclusive, indisputable evidence about anything. Instead, the key is to measurement is to reduce your uncertainty.
When you think about measurement in terms of the reduction of uncertainty then anything, even abstract and complicated topics like the number of civilizations in the universe, can be measured.
Every time you are narrowing your results and reducing the amount of doubt, you are measuring.
Why do we measure things?
We use measurement constantly in our daily lives, it’s everywhere you look – from science and business to cooking, music, agriculture, dance, engineering, manufacturing, navigation, and countless other domains.
Without the ability to measure, it would be nearly impossible to conduct experiments or form theories.
Measurement helps us do one, often all, of these things:
- Learn: It helps us discover the nature of things in our universe
- Think: It feeds into what we know, and helps us make better decisions
- Do: The learning and thinking based on measurements helps us take better actions
Whether it is deciding between medical treatments or where to invest our resources, good measurements can help us determine what we know, with how much certaintainty, and what actions to take.
How do we decide what measurements to make?
Start with our goals
As is often the case, it helps to start from the beginning.
“Knowing the goals of your measurements will help you to decide which measurements to make and how to make good measurements.”
Once you have clear goals you can build a model of the things that would help to measure. In an ideal world you could measure all of these with high fidelity.
However, in reality resources and information are scarce and asymmetric therefore we need to measure things that are likely to create the most value.
The value of information
The value of information is determined by how much answering a question allows a decision-maker to improve its decision. The key to determining value is how much new information will help the decision-maker improve his or her choice.
For example, your cost model for a business may have the cost of materials as anywhere from 25-75% of your budget. Knowing if it’s closer to 25% or 75% makes a big difference.
This value and can often be expressed in fungible terms such as money ($) or quality adjusted life years (QALYs) and must be traded against the cost of the information.
If it costs me $1k to determine whether my business is likely to lose $1m or profit $10m then that is money well spent.
The rule of five
The first measurements you make are often the highest value.
One example of this is the rule of five, which shows that if you pick five, truly random and diverse, data points in a normal distribution you can have a 93.75% certainty that the median is between the smallest and largest of those five data points.
This is a very cheap measurement to make and it makes it easier to then identify which measurements are worth the cost of refining.
What makes a good measurement?
Now you know what to measure and the importance of measurement, how can you identify if a measurement is a good one? The response is simple, proper measurements strive for accuracy, reliability, validity, and precision.
Let’s break down each one so you can spot a good measurement.

Accuracy
How close a measurement is to the actual value?
This basically means that if you measure something over and over again, you will consistently get results that are close to what they’re supposed to be.
For example, if you step on a scale and record your weight five times in a row, you may get slightly different results, but all are relatively close to what your actual weight is.
Precision
How close are the measurements are to one another?
This means that if you repeatedly measure something, you will get sizes that are close to one another to the smallest degree.
Using the scale example above, precise results would show your weight down to the gram and will show nearly the same weight each time.
Reliability
How dependable a measurement is when the experiment is repeated?
Something that is reliable continues to operate as initially built or designed over a long period.
Validity
Does the measurement measure what it was supposed to measure?
The different types of validity are internal validity, external validity, construct validity. For the difference between these I highly recommend the StatsDirect article about validity.
Many people are persuaded by things that are precise when often accuracy is more important when measuring results. If you get the same number every time, but your measurement is not close to what it should be, your findings will not be valid.
Why this matters?
When you know what area your measurement falls short, it can help to improve your overall analysis, or at the very least account for their failings.
How do we make good measurements?
Now that we know what constitutes a good measurement, how can you be sure that you are consistently making proper measurements? There are three rules to follow to make useful measurements.
1. Have clear definitions
When taking measurements, it’s important that your parameters are clearly defined to avoid confusion.
For example, if you are counting the number of cups on the table, you need to define what a “cup” means. Does it include glasses, mugs, etc. or are you only counting the plastic cups on the table?
Having these clear definitions prevent the mistakes and inaccuracies that could invalidate your findings.
2. Try to disconfirm our hypotheses
It’s very easy to find evidence for things we already believe. Robust beliefs are ones that we try to disprove, and they still last. This is also called falsifying.
Philosopher Karl Popper’s philosophy of science is widely accepted throughout the scientific community. He noted that every false belief we discover is actually good because it gets us closer to believing only true things. He found that the most robust hypothesis occurred when scientists tried to refute their own theories instead of merely confirm them.
For example, if someone believes that all swans are white and they go out seeking white swans, every time they see a white swan they confirm their belief. This is very easy to do but does not strengthen the initial hypothesis. Instead, trying and failing to find a black swan will result in a stronger argument for white swans.
So if we’re deciding what to measure, the highest value measurements can often be ones that disconfirm or falsify our core assumptions.
3. Avoid bias
When measuring for possible outcomes, it’s vital that you consider any bias or other effects that might impact your results. The biggest mistake that researchers make is changing too many variables at once.
For example, if you are trying to measure the effectiveness of pain treatment, you may hypothesize that diet and medication could impact the amount of pain a person experiences. If you ask your research subjects to adjust their diet and take medication at the same time, you will not be able to pinpoint which variable led to the reduction in pain.
A key way to avoid bias is to use a control group that will give you something to measure against, to help manage your variables and estimate the magnitude of each intervention.
The ways you reduce bias will vary depending on the goals and methods of your measurements.
How do we measure difficult or ‘intangible’ things?
Encountering things that are intangible, or difficult to measure, doesn’t mean that they cannot be measured. It means that you need to think about measurement in a new way and make use of proven techniques to adequately measure these things.
While Douglas Hubbard literally wrote an entire book on this, which I highly recommend reading, here’s a few ideas to help get you started.
1. Use proxy measures
A proxy or proxy variable is something that is not precisely what you are measuring but stands in place of an harder to measure variable. For it to be a good proxy, it must have a close correlation to what you are trying to measure.
For example, if you are trying to measure the depth that light pierces the ocean over large areas, you cannot simply measure that across large oceanic regions. Instead, you can look at satellite images of the ocean surface color as a measurement to help you reach a conclusion.
The truth is that using an imperfect proxy is often better than not using a critical variable at all. So if you reach the point in your research where you aren’t able to measure the intended variable, find a proxy that you can use.
2. Try the Fermi method
This method utilizes estimation to offer a fast, rough estimate of a quantity that is otherwise difficult to measure.
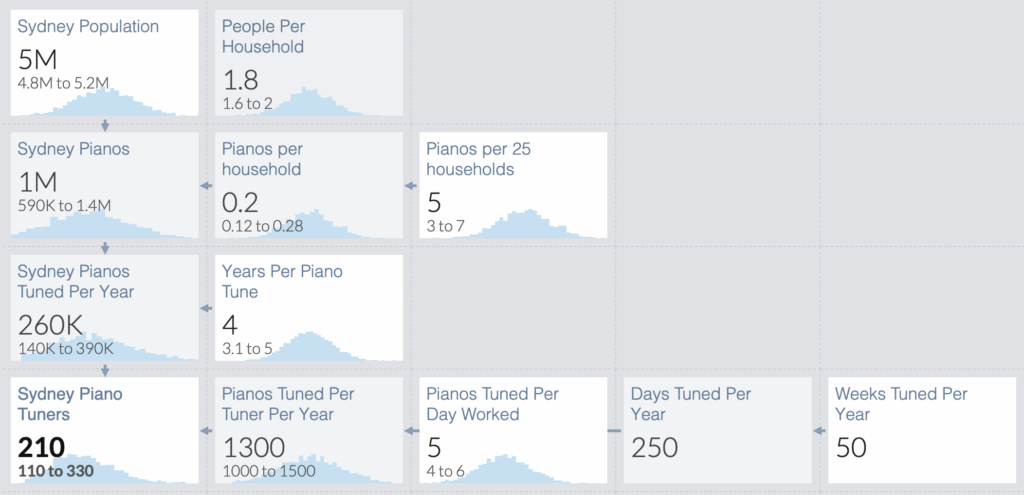
For example, say you are trying to find how many piano tuners are located in Sydney. This is a tough thing to measure, so to reduce uncertainty you can offer an estimation based on the population size.
If you already know that the population of Sydney is roughly 5 million people, and you assume that the average size is roughly 2 people per household, there are about 2.5 million households in Sydney.
To find out how many people own a piano, you used a sample of five and asked five random people to pick their household and four households of other people they know and how many had a piano. Out of those 25 samples, 5 had pianos. So you can assume that roughly one in five households have a piano, resulting in 1,000,000 pianos in Sydney.
If the average piano tuner is able to tune five pianos each day for five days of the week and took a two-week vacation. Then in 50 weeks, that person would service 1,250 pianos. Knowing that each piano needs to be tuned roughly once every four years, that would mean that there are 200 piano tuners in Sydney.
This is the Fermi method in action, where you can measure anything using estimation. Often this is correct within an order of magnitude – meaning that there are closer to 200 piano tuners than either 2000 or 20.
My favourite tool for doing Fermi Estimates is Guesstimate. It helps you to build models with range estimates while choosing types of distributions and seeing where the model is most sensitive.
It does this using Monte Carlo simulations which essentially do many calculations of random numbers within your range (which can fall in customised distribution patterns). You can see my Fermi estimate of pianos in Sydney built with GuessTimate.
3. Use calibrated estimators
For future events that don’t have strong past predictors, well-informed people can often give useful forecasts that are actually predictive. The goal is to establish a feedback loop that can provide improvements in calibration.
Researchers, and all people, tend to be biased toward overconfidence or underconfidence. To give you a better understanding, overconfidence is classified as routinely overstating knowledge and being correct less often than expected.
Take the weather forecast, for example. We cannot judge the accuracy of a forecast in isolation, but we can look at a large number of forecasts to determine our level of confidence. The track record of a meteorologist is not looking at whether it rained when they predicted a 70% of rain one time, but whether it rained 70% of the time when looking at all the times they predicted 70% of rain over the past three months.
This is calibration and using calibration by plotting the percentage of correct predictions throughout many forecasts, you can identify whether to feel overconfident or underconfident.
I highly recommend the book Superforecasters and checking out forecasting tournaments like Good Judgement Project Open and Metaculus. You can track the accuracy of your own predictions using PredictionBook and you can take free calibrated estimator training using the Open Philanthropy program.
How to draw conclusions from measurements
1. Using measurements to build models
Models are a simplified representation of the world that helps us navigate it (e.g. a map is a 2D low fidelity mode). The Fermi estimate we used earlier in estimating the number of pianos is a good example of a model.
No matter what topic piques our interest, we make measurements so that we can build models that can help us better predict (and change) the future.
When building models, we should think of a useful and straightforward representation of the phenomena we’re trying to predict and use measurements to make predictions and test that model. Alfred Korzybski once said “a map is not the territory” to remind us that a model is a simplification. This is extended upon by the adage concisely put by George Box “all models are wrong, some models are useful” – reminding us that simplification isn’t bad if it helps us so long as we bear in mind the limitations.
Once you begin drawing conclusions and building models based on your measurements, it’s important to be aware of other factors that could impact your findings.
Next we’ll go through some things to consider when concluding your measurements.
2. Confirmation and disconfirmation
When the measurement is complete, it’s time for researchers to evaluate their findings and how they apply to their original goal, or hypothesis. This evaluation results in confirmation or disconfirmation.
- Confirmation means that the findings lend further support and depth to patterns that emerge from the data collection, or measurement.
- Disconfirmation results when the findings show an alternate, or rival, explanations that do not fit the patterns of your original theory.
This helps researchers understand and explain the limitations of their research findings. This allows researchers to develop a richer and deeper understanding of their theory and lend credibility to their research.
However, we need to remember that most confirmatory and disconfirmatory evidence should only update our beliefs in accordance with the strength of the evidence.
3. Bayesian updating
We often think of our worldview as binary (right/wrong, yes/no, etc.) when in fact, there are many possible outcomes when looking at any given situation. Research does not always find a clean and definitive answer, rather the greatest possible outcome for any given situation.
The overarching goal with measurement is to narrow your estimation to find the most probable outcome. Not updating your beliefs, or narrowing your view, could mean that you are overlooking key results in your research that will impact the validity of your findings.
Bayesian updating uses prior information to help determine the level of probability an event or result will occur. It rests on the foundation that we believe in a result based on the information that is available to us, and if that information changes, our beliefs can change.
When generating your findings to make predictions, you need to keep an open mind and take into account whether your measurements could be explained by an alternate hypothesis.
You will want to think about both possible outcomes to determine whether the measurements support or refute your theory.
This approach gives us the ability to update the probability of a hypothesis as more data becomes available, allowing observed information to influence beliefs.
Bayesian thinking can also help us reassess any competing hypotheses in the presence of new evidence. It also resembles how we intuitively think about the probability in everyday life.
Visual guide to Bayesian thinking
Julia Galef‘s Visual guide to Bayesian thinking video excellently describes Bayes Rule and these three principles for using it:
- Remember your priors
- Imagine your theory is wrong. Would the world look different?
- Update incrementally (even small pieces of evidence adds up)
More on Bayesian thinking
I also highly recommend listening to Positly co-founder Spencer Greenberg on the 80,000 Hours Podcast with Rob Wiblin discussing Bayes Rule and how to update your beliefs over time as new information comes in. They discuss the odds method of updating and once you know it, it’s even easy to do it in your head.
4. Remember correlation does not mean causation
If two measurements are found to be correlated, it can be tempting to assume that one of the measurements, or variables, causes the other. Two variables that are linked together by correlation, meaning that you observe a change in one variable concurrently with the change in another variable, does not mean that one change causes the change in the other variable.
For example, you measure that sales of sunglasses increase during a period where ice cream consumption also increases. Does that mean that the purchase of sunglasses causes the increase in ice cream consumption? No, while these variables might be correlated, one does not create the other.
When drawing conclusions it’s essential to distinguish correlation and causation and refrain from tying two variables together via causation just because they are correlated.

5. Keep it simple and don’t overfit
When you try to build a model that adapts itself too closely to the data you have, providing little insight into what will happen in the future, it will result in overfitting. Overfitting, or fitting a model too closely to historical data, can hardwire error into the model.
This precise prediction of the past cannot tell us what the future holds. The key when building a model is to create a simplified representation of historical data that follows a pattern that can be used to provide predictions about what will happen next.
The video below demonstrates overfitting in a machine learning model.
If the only two men I know from Canada like to be greeted by a hug and the only women I know from Canada likes to be greeted by a handshake and has blonde hair it’s unwise to simply assume that when I make my trip to Canada I should hug every Canadian man I meet and that all Canadian women have blonde hair.
6. Iterative models and experimentalism
You can test the accuracy of your model by making predictions and testing your model. As you make predictions and test your model, you can continue to confirm or disconfirm the certainty of your model and adjust the predictive capabilities you’ve built.
If we focus our iterations on where we can get the highest value information gains at the lowest cost we progress faster to a world where we have a better grasp of reality and more flourishing.
Final thoughts
It’s important that we always be willing to let our beliefs go, to accept the evidence we’ve discovered and move on. It is a balance between remaining skeptical and open minded while being able to satisfice and take action once we’re satisfied our measurements are good enough while keeping mindful of their shortcomings.
What we measure matters. Our measurements allow us to look at past data, predict the future, and make impactful changes to alter the future.
Our impact can be tiny or enormous, and with the help of good measurements, we can continue to make positive changes in all areas of life.